OpenTelemetry is an observability framework that provides the libraries, agents, and other components that you need to capture telemetry from your services so that you can better observe, manage, and debug them. It allows you to capture metrics, distributed traces, resource metadata, and logs (logging support is incubating now) from your backend and client applications and then sends this data to backends like Elastic APM.
As you probably have heard of at this point OpenTelemetry is the result of the merge between OpenTracing and OpenCensus, and it aims to provide a more complete, vendor neutral, easy-to-use framework to implement your observability needs.
In this post I will describe how to get started with OpenTelemetry using Elastic APM as your backend. Examples of microservices written in Java and Go will be provided.
OpenTelemetry Architecture
The first step to understand any technology is to capture the essence of its architecture. OpenTelemetry was created to allow developers to implement observability without necessarily being tied to specific vendor APIs. With this goal in mind, the architecture was broken down into three main components: agents, collectors, and exporters.
The role of the agent is to ensure proper instrumentation of the target application. It literally sits in the application layer and in case some programming languages offer automatic instrumentation using specialized agents, whereas other programming languages may need to include the instrumentation manually. Regardless, it is the layer that captures the raw data needed for observability: logs, metrics, and traces. These are usually known as telemetry data.
Once the agent collects the telemetry data from the target app it needs to process them and export to the collector, which will be discussed later. But for now just keep in mind that even within the app there is some processing being done already in the telemetry data collected, whether this processing is to buffer/queue data locally before sending those out, or perhaps is to augment the raw data with some context data needed for your observability needs. It is important to understand that the processing part in the agent is optional, you can delegate this responsibility to the collector.
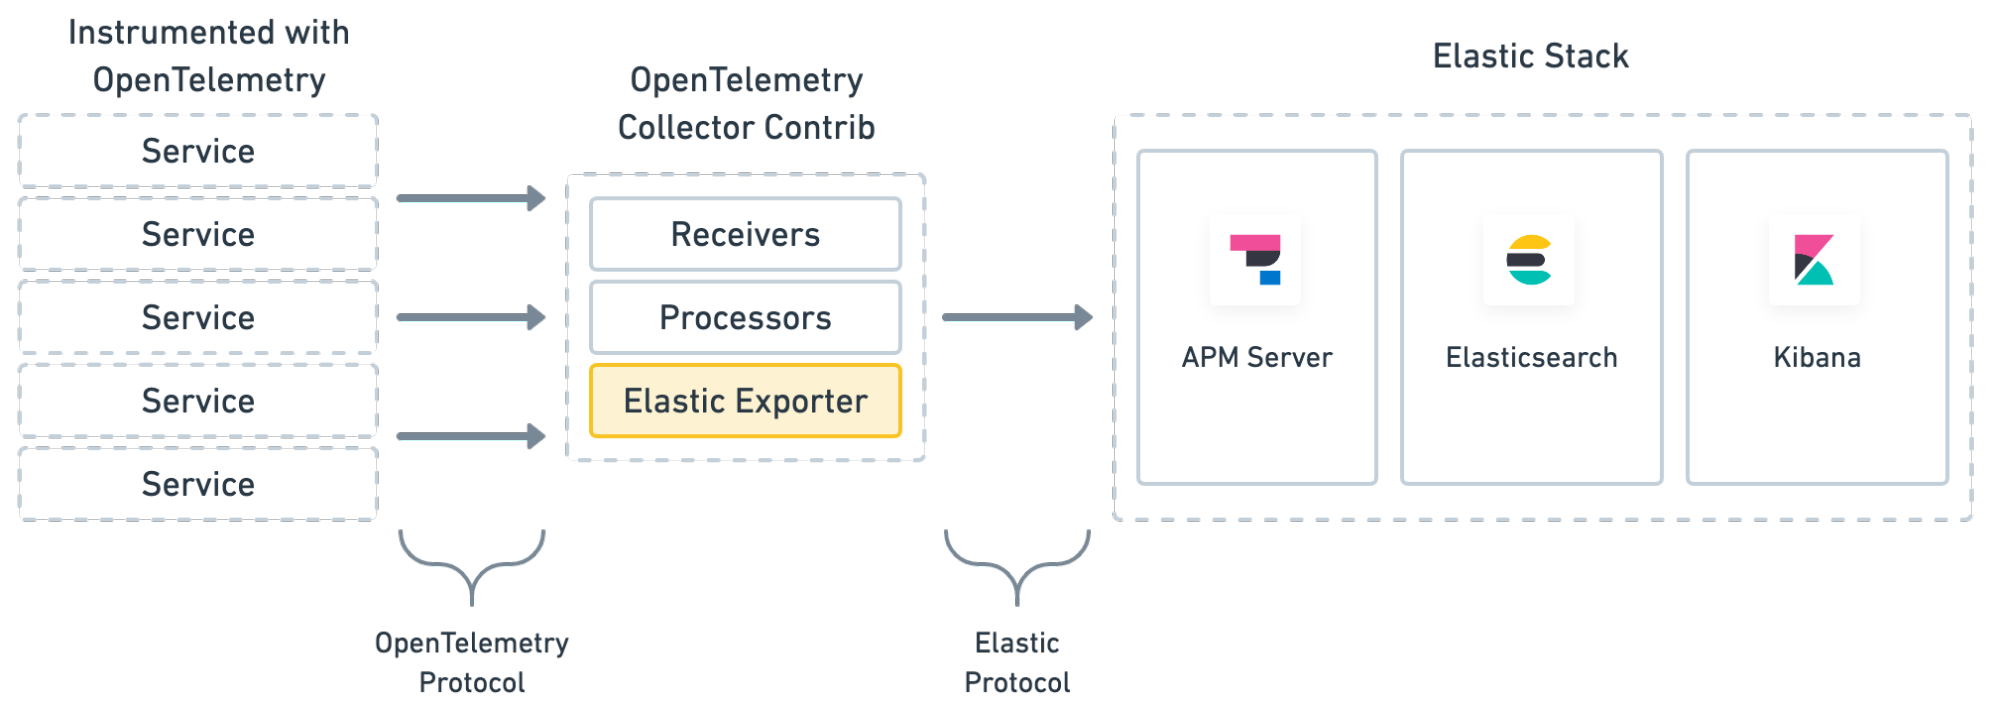
The collector as the name implies collects telemetry data from the instrumented apps and its unique responsibility is to decouple the agent from the backends. While in some cases it may be possible to send the collected data straight from the instrumented app to the backend — as a best practice you should use a collector for this. Here are some reasons. First, the collector can buffer/queue data for you automatically before sending to the backend, which is an implementation that you can offload from your app. Secondly, the collector knows how to talk with the backend and it does so in a pluggable manner, which means that your app doesn’t need to know any details of the backend nor having one of its dependencies. Hence why OpenTelemetry is known for being so pluggable and extensible.
Finally, the communication between the collector and the backend is implemented using the concept of exporters. Exporters as the name implies know how to export the collected data to a backend, and the collector allows multiple exporters to be used at the same time. This means that your collected data can be sent to both Elastic APM and Zipkin, for example. This architecture allows easy migration paths from one backend to another.
The diagram below depicts the architecture discussed so far.
Collectors don’t need to be implemented manually. The OpenTelemetry project provides a ready to be used implementation written in Go that is super fast, scalable, and customizable. You can optionally customize the collector to include different receivers, processors, extensions, and exporters — but in general the collector AS-IS will suit your needs.
Like what happens with any technology, after understanding the architecture the best way to actually digest the technology is to create a mental map using an example. And this is exactly what we are going to do now.
Example using Java
If you are a Java developer then all you need to do is to execute your Java app using the OpenTelemetry agent for Java. Once you do this, your app will be automatically instrumented with the needed bytecode and by using some special environment properties you can customize how the app talks with the collector, among other things. The default protocol used by the agent to communicate with the collector is OTLP and you can customize which OTLP endpoint to use using the following environment variables:
      export OTEL_EXPORTER=otlp
      export OTEL_EXPORTER_OTLP_ENDPOINT=collector:55680
      export OTEL_RESOURCE_ATTRIBUTES=service.name=hello-app,service.version=1.0
This instructs your app to send the telemetry data collected to an endpoint called collector:55680 that will be responsible to send this data to the backend. All major stacks in Java will be automatically instrumented so you don’t need to write spans by yourself for those. However, if you want to extend your code and make it more traceable you can create your own spans like this:
    private final TracerProvider tracerProvider =
        OpenTelemetry.getGlobalTracerProvider();

    @RequestMapping(method= RequestMethod.GET, value="/hello")
    public Response Car() {

        Tracer tracer = tracerProvider.get("hello-app", "1.0");
        Span customSpan = tracer.spanBuilder("custom-span").startSpan();
        try (Scope scope = customSpan.makeCurrent()) {
            customSpan.setAttribute("custom-label", "Duke");
        } finally {
            customSpan.end();
        }

        return new Response("Hello World");

    }
Once you execute the instrumented app a few times here is what you will see in Elastic APM:

You can find an end-to-end example for Java in this repo: https://github.com/riferrei/otel-with-java
Example using Go
If you are a Go developer then your road to have your app sending telemetry data to the collector is a bit longer but not necessarily complicated. Go doesn’t have an actual agent that does automatic instrumentation but it has all you need to bring this instrumentation into your app. For example, here is how to code your way out to have the app sending data to a collector running on collector:55680:
	collectorAddress := os.Getenv("COLLECTOR_ADDRESS")
	exporter, err := otlp.NewExporter(
		otlp.WithInsecure(),
		otlp.WithAddress(collectorAddress))

	if err != nil {
		log.Fatalf("Error creating the collector: %v", err)
	}

	bsp := sdktrace.NewBatchSpanProcessor(exporter)
	defer bsp.Shutdown()

	res := resource.New(
		semconv.ServiceNameKey.String(serviceName),
		semconv.ServiceVersionKey.String(serviceVersion),
		semconv.TelemetrySDKNameKey.String("opentelemetry"),
		semconv.TelemetrySDKLanguageKey.String("go"),
		semconv.TelemetrySDKVersionKey.String("0.13.0"))

	tracerProvider := sdktrace.NewTracerProvider(
		sdktrace.WithSpanProcessor(bsp),
		sdktrace.WithResource(res))

	global.SetTracerProvider(tracerProvider)
	global.SetTextMapPropagator(otel.NewCompositeTextMapPropagator(
		propagators.TraceContext{}, propagators.Baggage{}))
As you can see the code takes the endpoint from an environment variable so it is imperative so set this before executing your app. Also note that essentially what this code does is to create a local processor that will handle the collected telemetry data and then instantiate a new tracer provider, as well as make this tracer provider available throughout the entire app. This is important because in any given point of the code you can simply write this to create your own spans:
	ctx := request.Context()

	_, customSpan := tracer.Start(ctx, "custom-span",
		trace.WithAttributes(
			label.String("custom-label", "Gopher")))
	customSpan.End()
Note that almost like magic the span can be created without necessarily creating a tracer from a tracer provider like we do in Java. But in the end the logic is the same, tracers will be coming tracer providers. The only difference is that the tracer provider in Java is obtained automatically whereas in Go you need to explicitly create it.
Once you execute the instrumented app a few times here is what you will see in Elastic APM:
You can find an end-to-end example for Go in this repo: https://github.com/riferrei/otel-with-golang
How the Collector talks with Elastic APM?
The communication between the collector and Elastic APM is implemented using an exporter. All you have to do is register a new exporter in your collector configuration to send data to Elastic APM as shown below:
exporters:
  elastic:
    apm_server_url: "<APM_SERVER_URL>"
    secret_token: "<SECRET_TOKEN>"
This approach is simple but incredibly powerful. First and foremost, it creates a de-facto vendor neutral approach for your apps to send telemetry data to Elastic APM since it relies on the collector architecture. Sending data directly to a backend is fundamentally wrong since it couples the app to the backend. Sometimes the coupling is not about having to write specific code per-se but it is about having to include the vendor’s dependencies in your code.
The power comes from the fact that Elastic APM is implemented on top of Elasticsearch which is a proven solution to address elasticity and scalability without dropping much of a sweat. Also, with data on Elasticsearch everything can be searchable with Kibana — which makes the experience of handling data on Elastic APM way simpler and joyful.